William Morris palettes for the R Environment (morris)
🎨 Six new colour schemes for the tidyverse 🎨
 Image credit: V&A Museum
The morris package
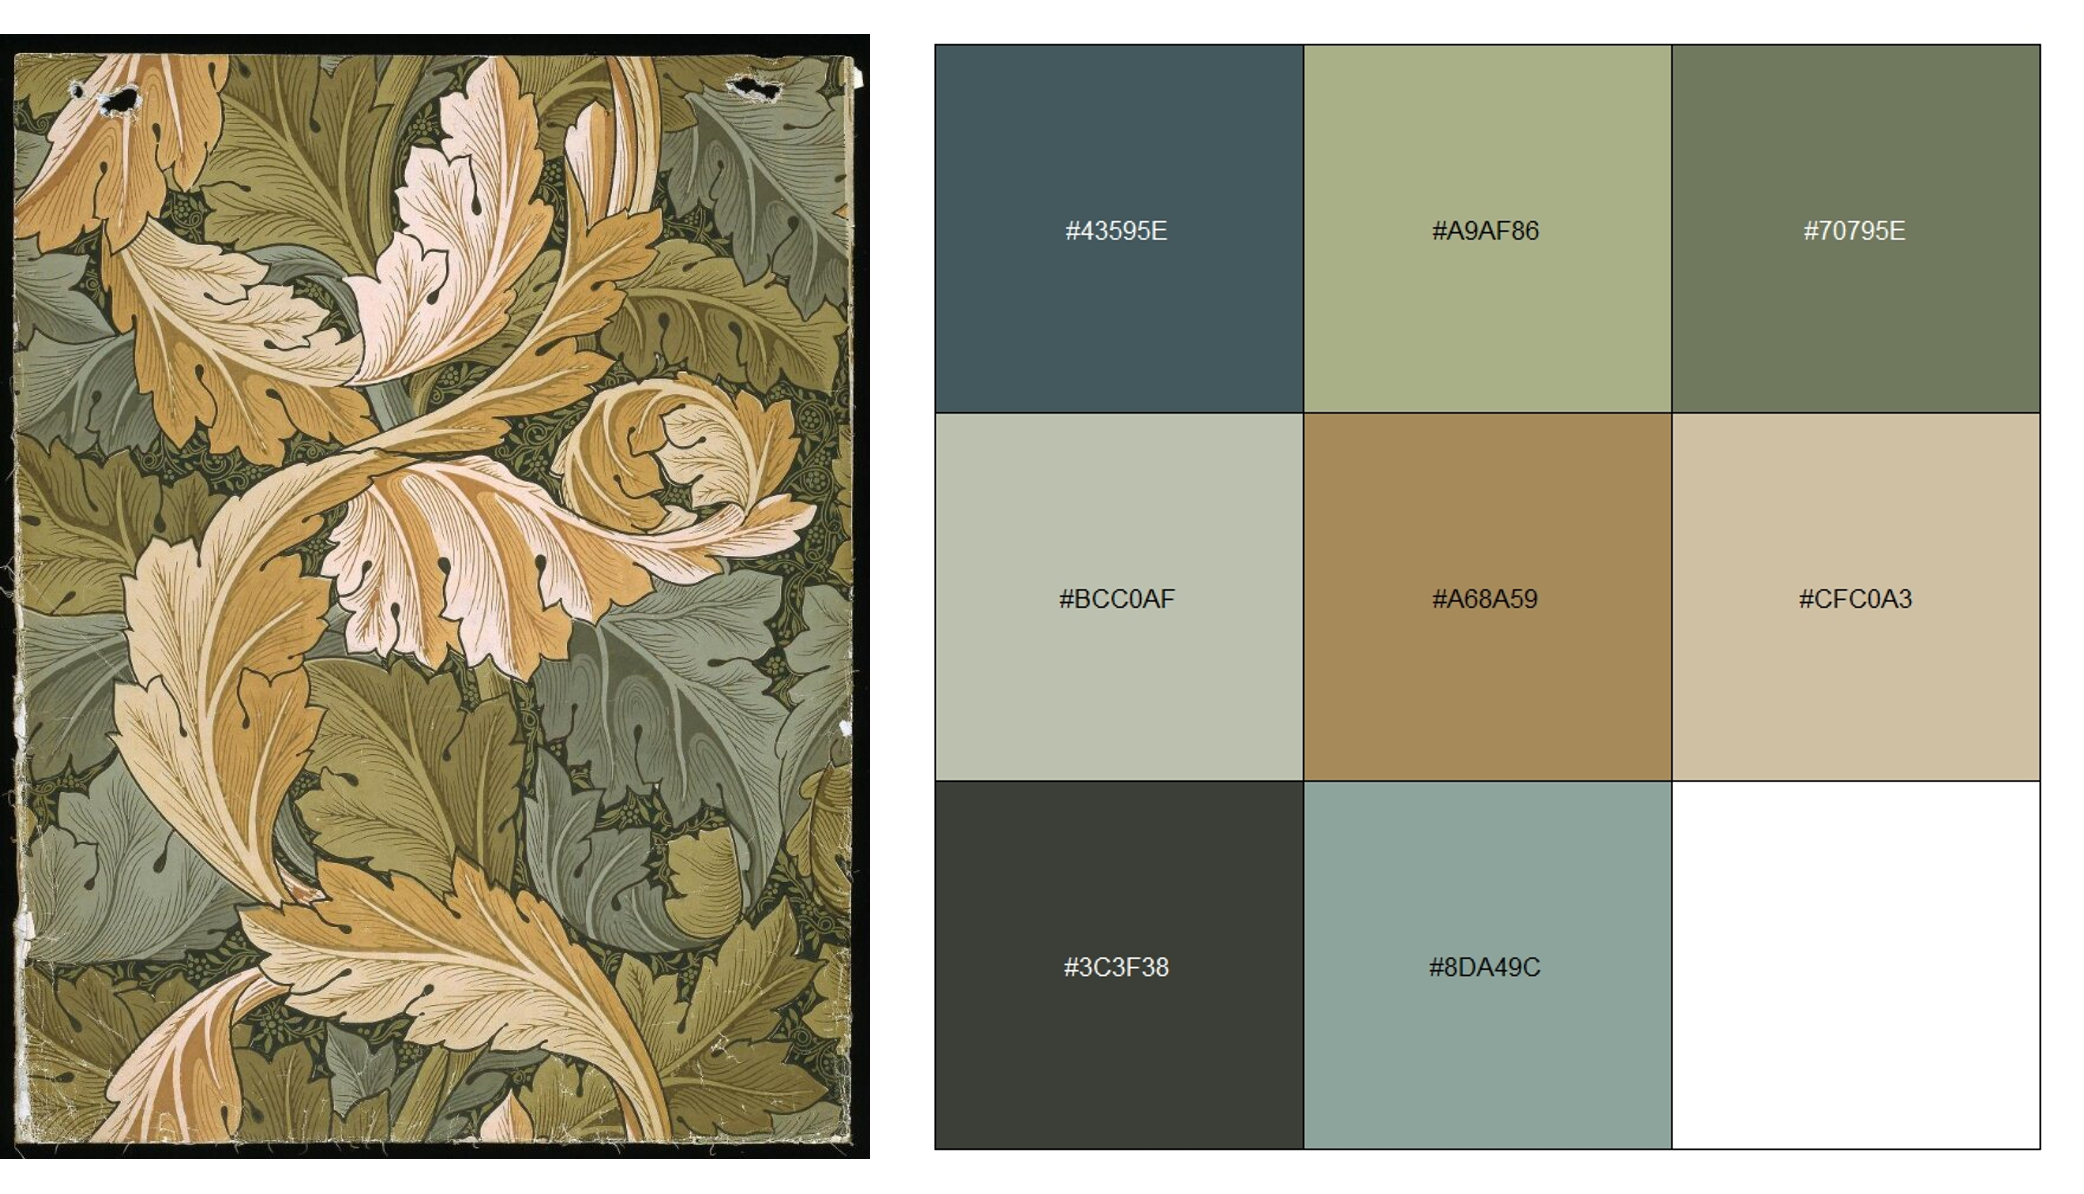
The package provides a number of palettes for ggplot2 inspired by the British textile designer, poet, novelist and activist William Morris. William Morris (1834-1896) was a major contributor to the revival of traditional British textile arts and is best associated with the British Arts and Crafts movement. Rooted in the Modern Style (British Art Nouveau), the Arts and Crafts movement was known for traditional craftsmanship, often using medieval, romantic and folk styles of decoration. Known for its advocation of economic and social reform, the movement was strongly anti-industrial, and prior to the 1930s had a strong influence on the arts in Europe.
magick and imager packages)Installation
Please use the devtools package in order to install morris.
devtools::install_github("cshoggard/morris")
A further five of William Morris' most famous works are included:
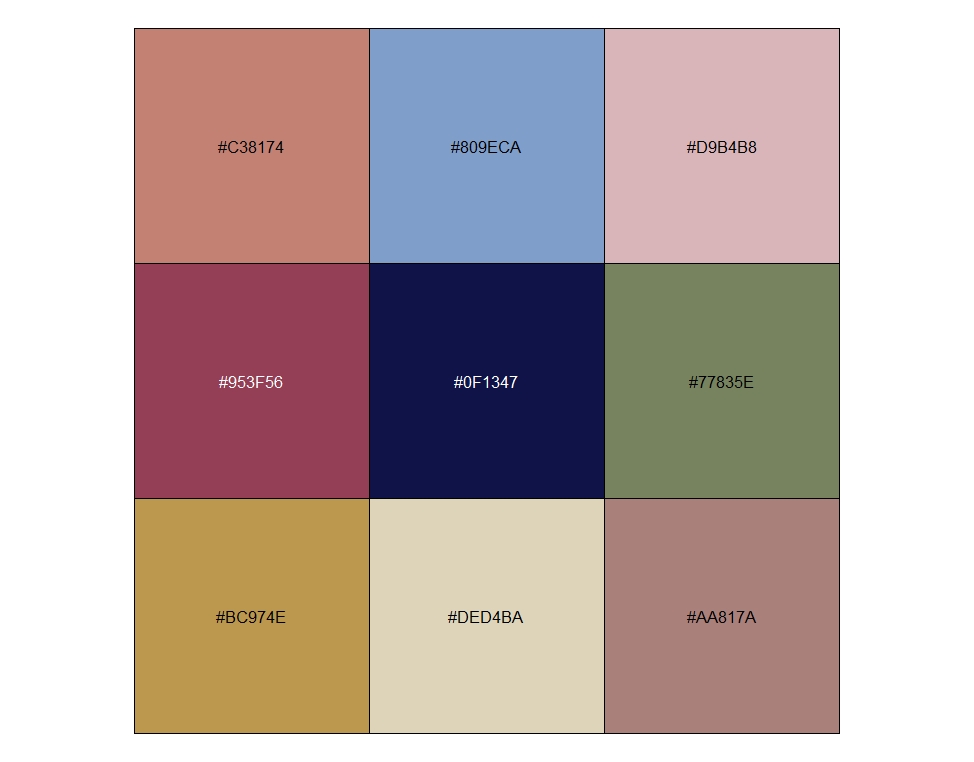
Strawberry Thief (1883). V&A Museum no. T.586-1919.
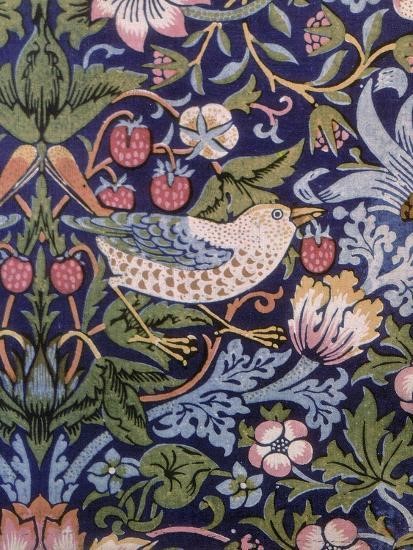
scales::show_col(morris:::strawberry_palette)
Trellis (1864). V&A Museum no. E.452-1919.
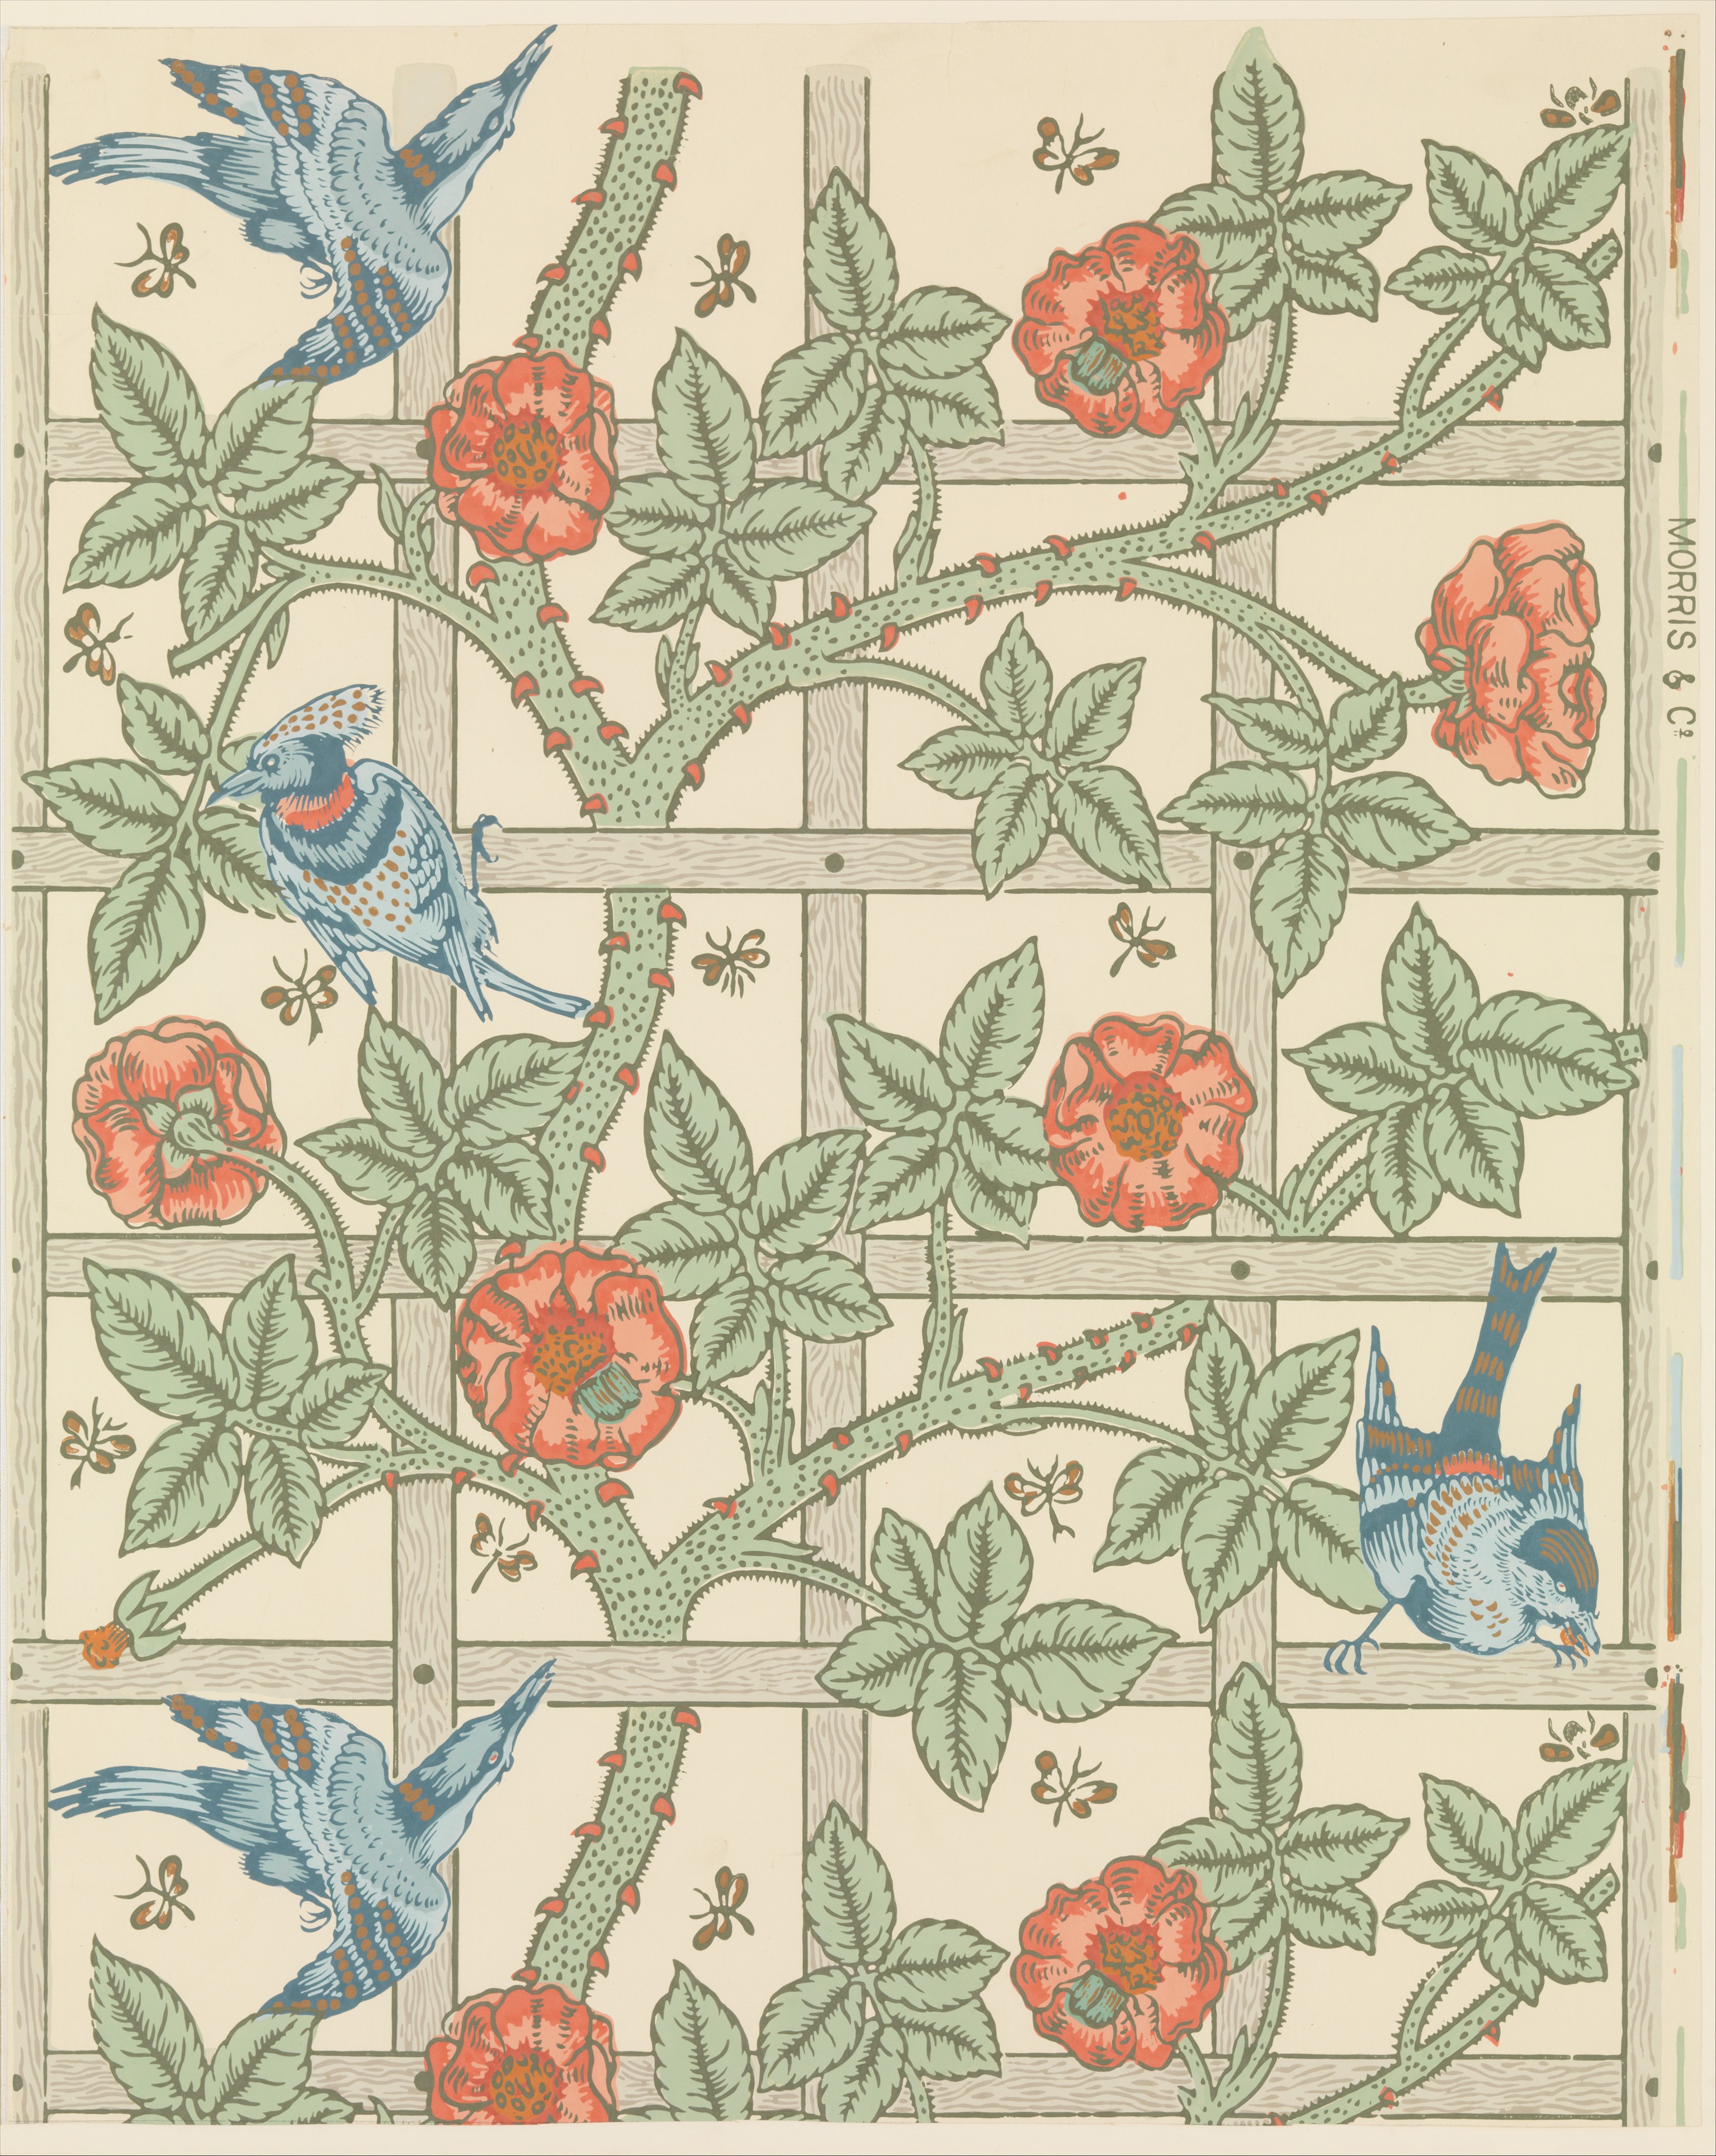
scales::show_col(morris:::trellis_palette)
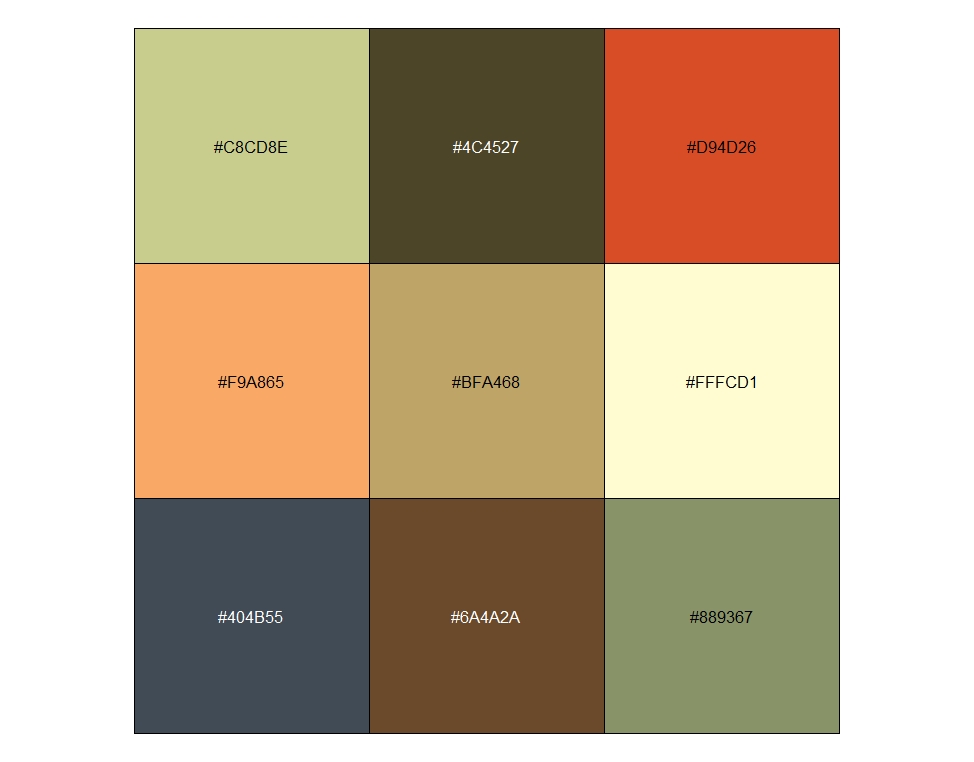
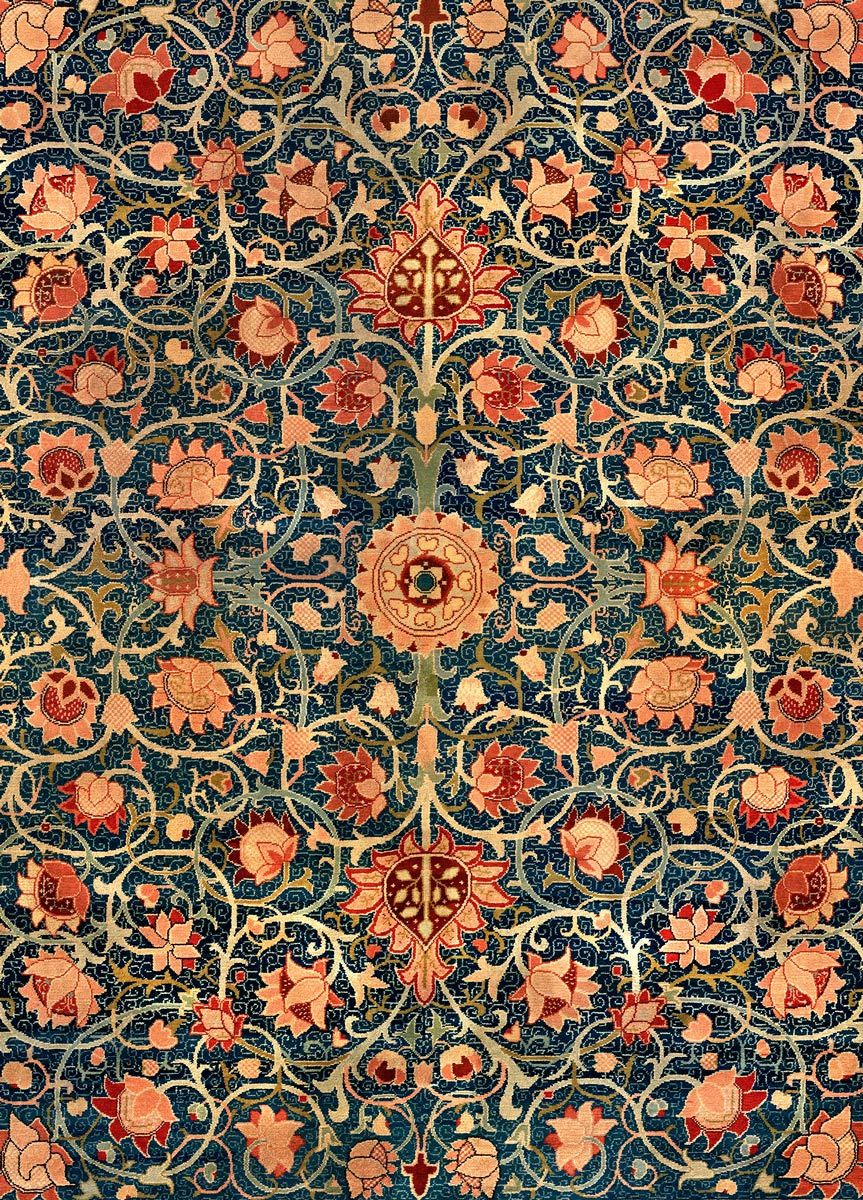
Holland Park (1883). Met Museum no. 27.139.3.
scales::show_col(morris:::holland_palette)
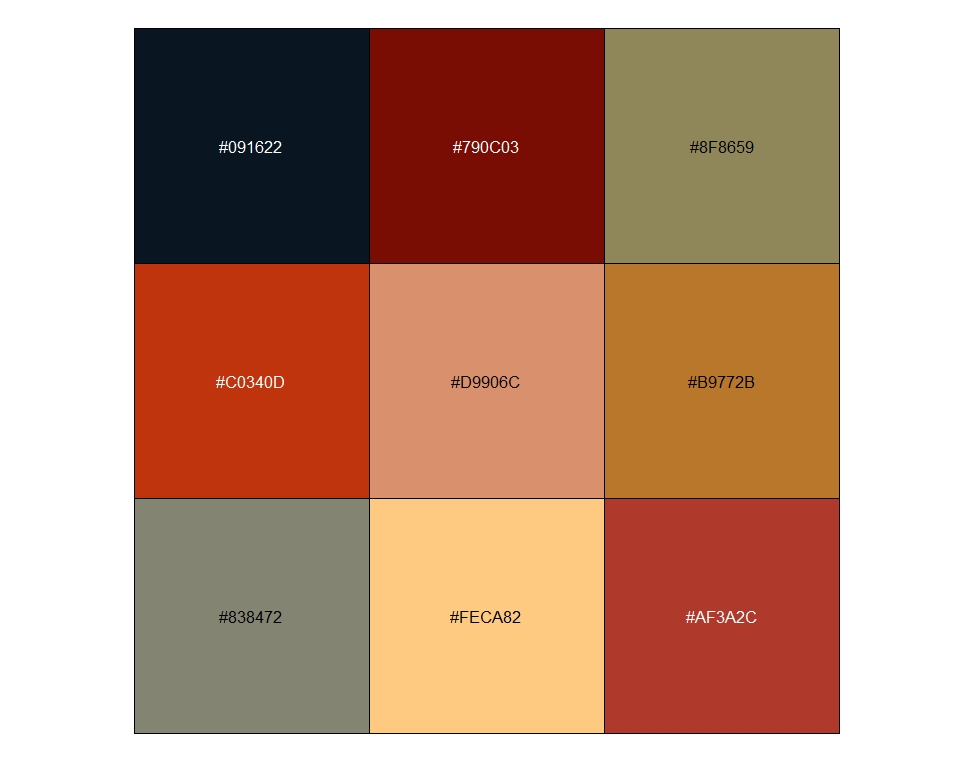
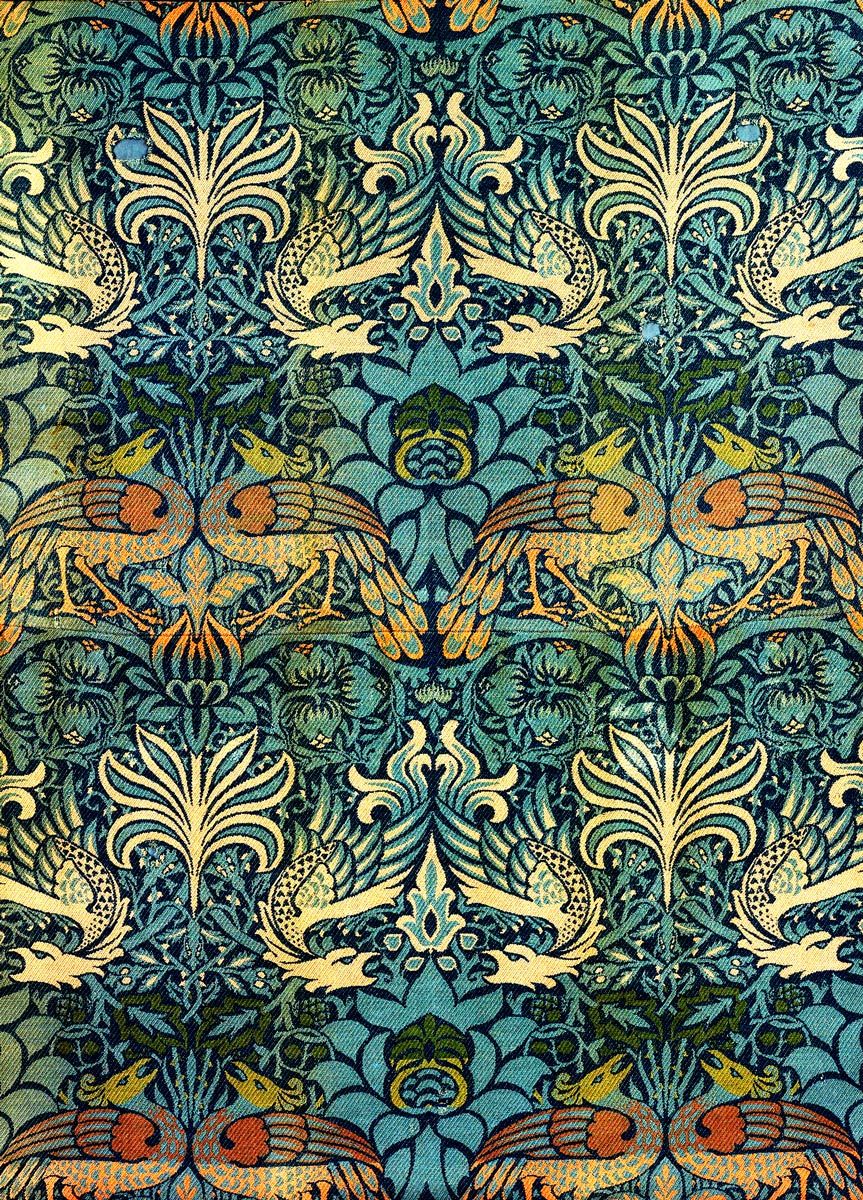
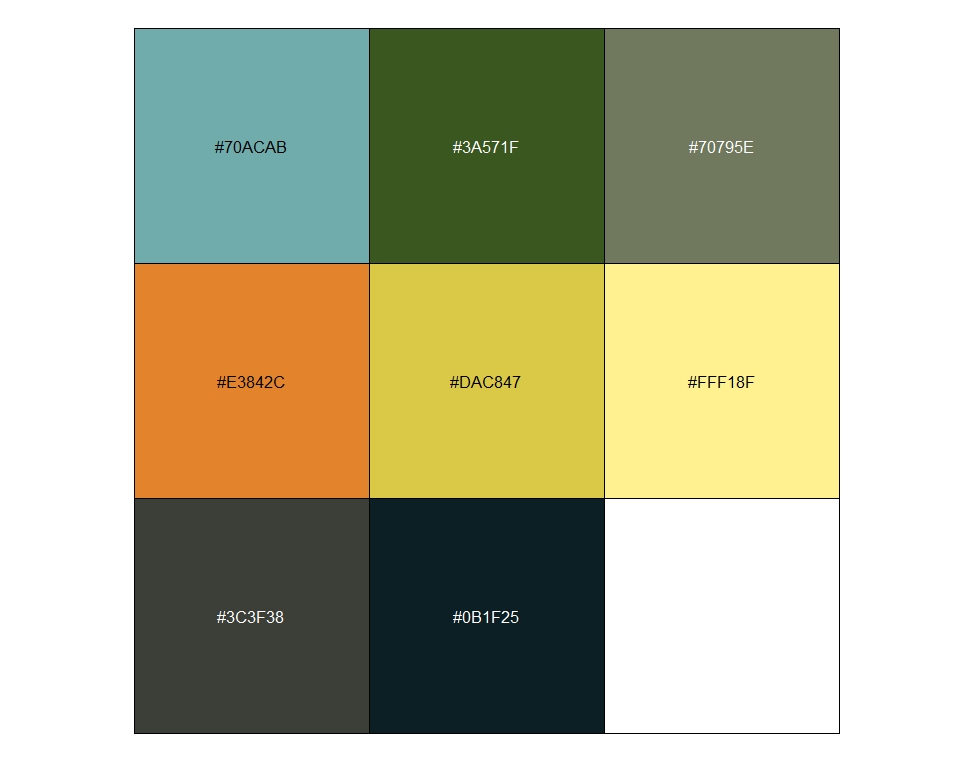
Peacock and Dragons (1878). WMG no. F26e.
scales::show_col(morris:::peacock_palette)
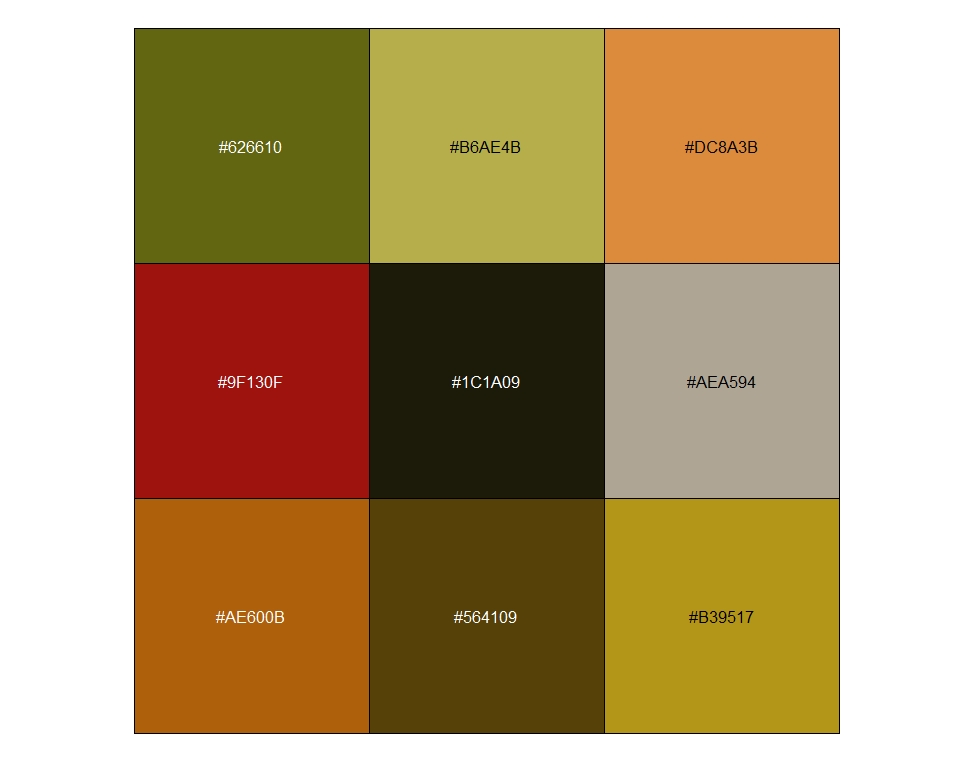
Embroidery with Flowers and Leaves (Leek Embroidery Society) (1885-1895). Rijksmuseum no. BK-1994-28.
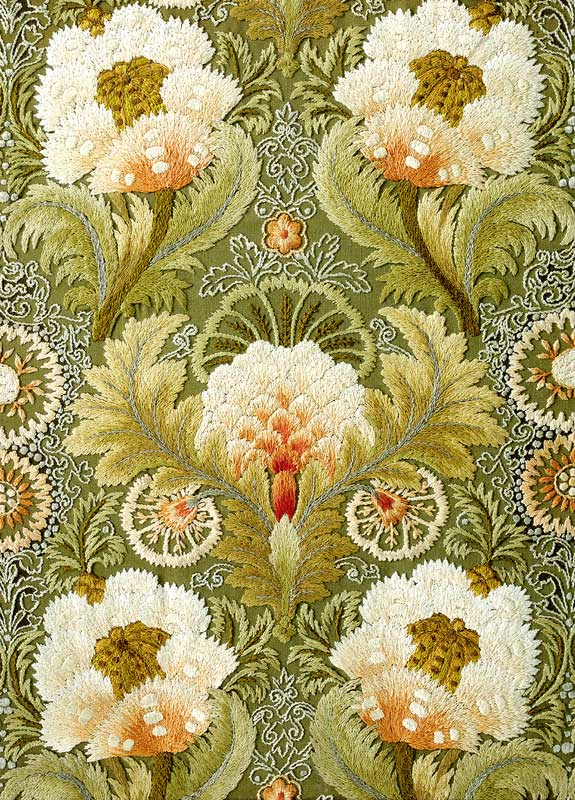
scales::show_col(morris:::flowers_palette)
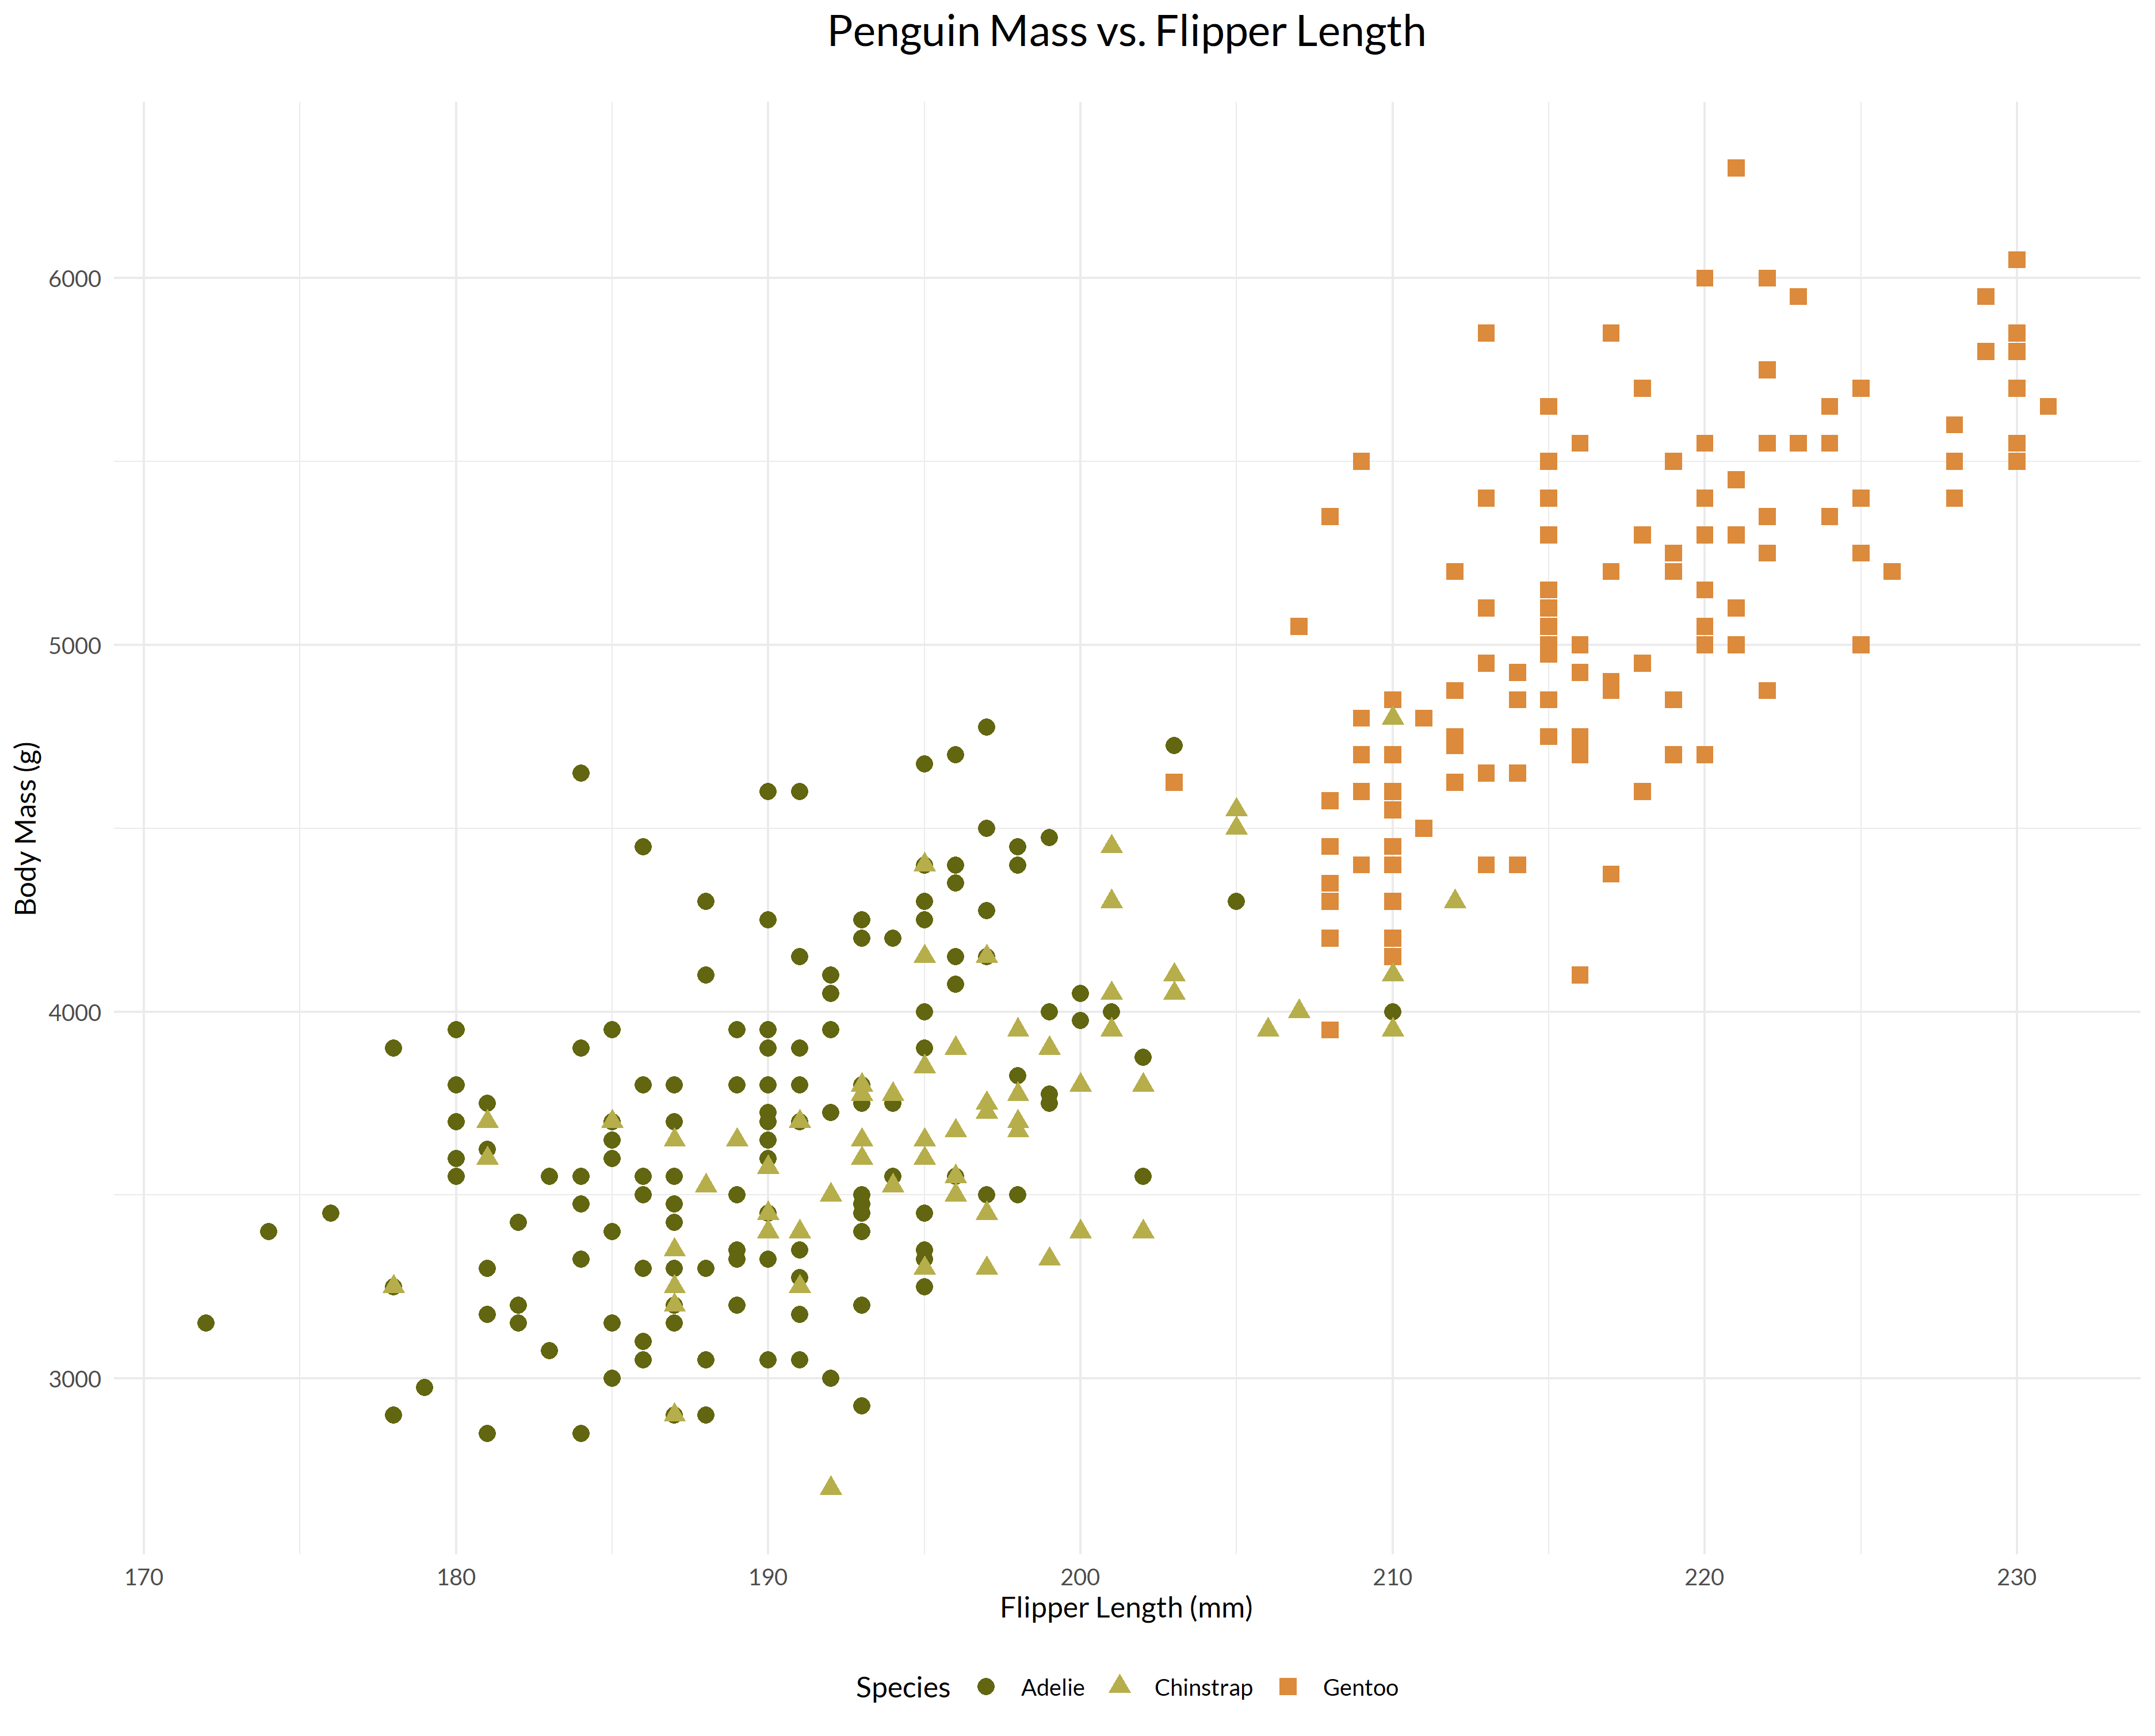
An example:
library(tidyverse)
#> -- Attaching packages ------------------------------------------------ tidyverse 1.2.1 --
#> v ggplot2 3.1.0       v purrr   0.3.0
#> v tibble  2.0.1       v dplyr   0.8.0.1
#> v tidyr   0.8.2       v stringr 1.4.0
#> v readr   1.3.1       v forcats 0.4.0
#> -- Conflicts --------------------------------------------------- tidyverse_conflicts() --
#> x dplyr::filter() masks stats::filter()
#> x dplyr::lag()    masks stats::lag()
library(morris)
library(palmerpenguins)
library(extrafont)
#> Registering fonts with R
loadfonts(device = "win")

theme_set(theme_minimal(base_size = 12, base_family = "Lato"))

penguins %>%
  ggplot(aes(flipper_length_mm, body_mass_g, shape = species, colour = species)) +
           geom_point(size = 3) +
  scale_colour_flowers() +
  labs(title = "Penguin Mass vs. Flipper Length",
       x = "Flipper Length (mm)",
       y = "Body Mass (g)",
       shape = "Species",
       colour = "Species") +
  theme(plot.title = element_text(size = 18, hjust = 0.5, margin = margin(0,0,20,0)),
        legend.position = "bottom")
Christian Hoggard
Senior Data Insight Analyst & Computational Archaeologist
Dr. Christian Steven Hoggard is a computational archaeologist and Senior Data Insight Analyst at the University of Southampton. Christian is interested in quantitative approaches to the past, R-based approaches to data science, and data visualisation.